Market Insights

The analysis behind
the chart.

Mortgage rates, Treasury yields, housing activity, borrower strategy and the market forces connecting them — archived so each daily market post becomes part of a permanent research library.

Featured · Mortgage Rates

30-Year Fixed Mortgage Rates: The Chart Still Matters

September 2026·Technical + fundamental analysis

The Fed does not directly set the 30-year fixed. See what the 5-year and 10-year moving averages, MACD momentum and the broader bond-market backdrop are telling us.

30-Year FixedMACDMoving AveragesTreasury YieldsMBS
Read full analysis
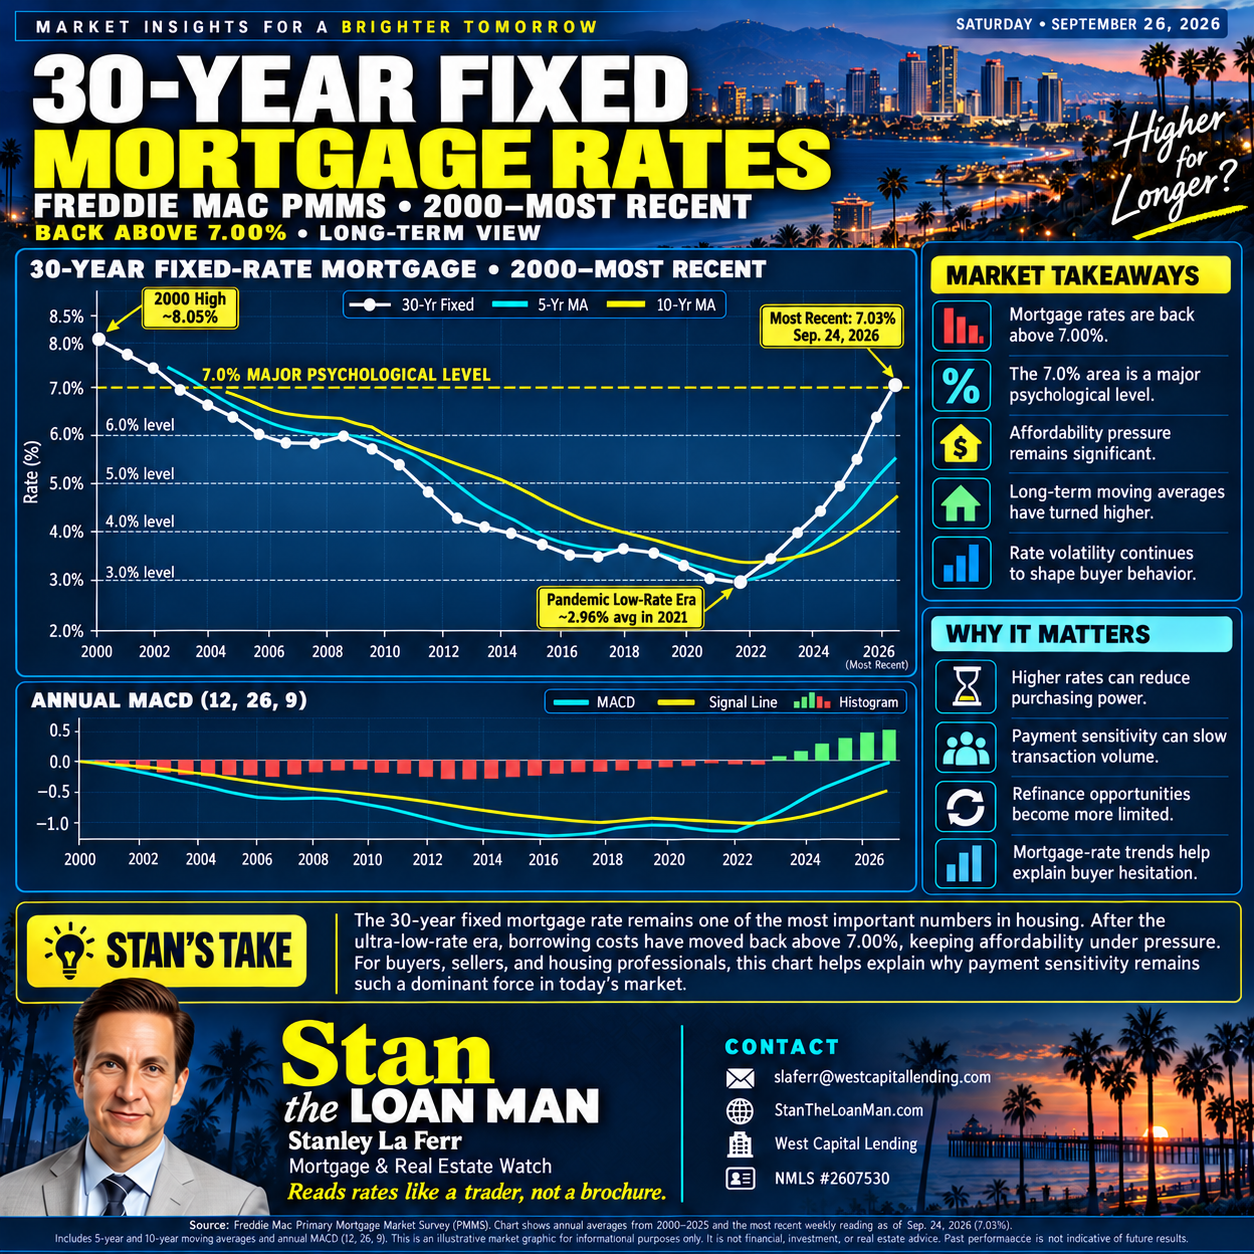
30-year fixed mortgage rate market chart from 2000 through September 2026

Market Insights archive

Browse by topic. As new LinkedIn posts become long-form MREWatch articles, they will be added here with a permanent URL.

30-year fixed mortgage rate chart
Mortgage Rates · Sep. 2026

30-Year Fixed Mortgage Rates: The Chart Still Matters

Moving averages, MACD, the Fed misconception and the market forces shaping mortgage pricing.

Read full analysis →
Southern California home sales volume chart
Housing Market

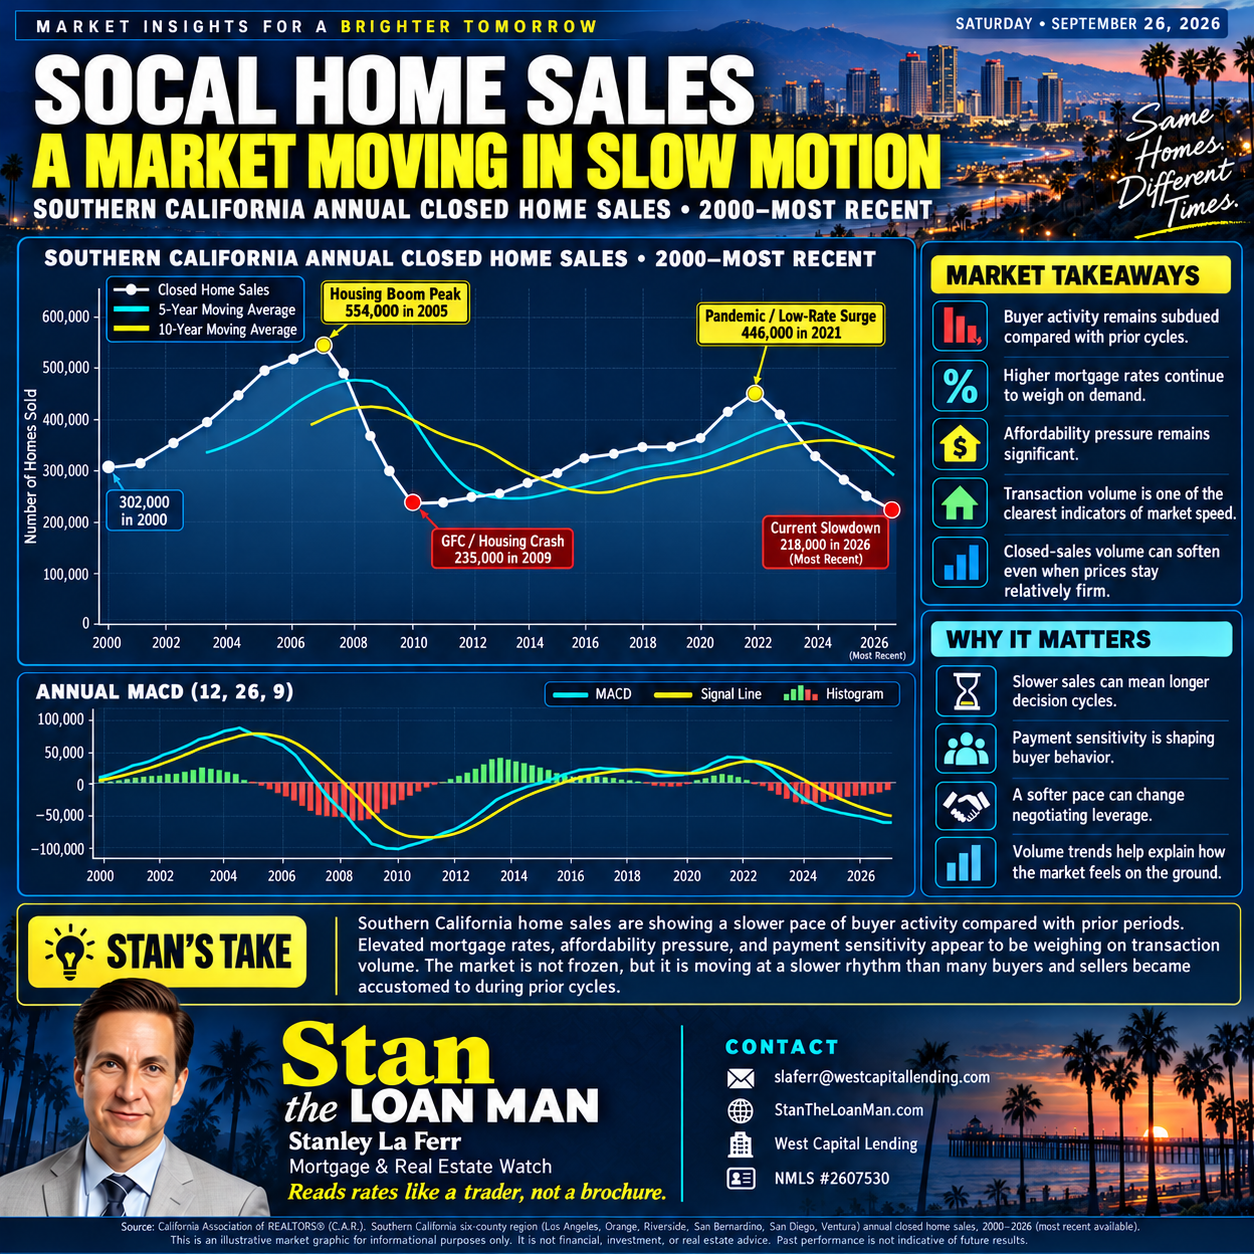
SoCal Home Sales: A Market Moving in Slow Motion

Why transaction volume can reveal market weakness that price headlines alone may miss.

Coming next
U.S. debt and 10-year Treasury chart
Treasury & Bonds

U.S. Debt & the 10-Year Treasury

How Treasury supply, investor demand and fiscal borrowing can feed into long-term yields and mortgage pricing.

Coming soon
10-year Treasury Closing Bell market chart
Market Commentary

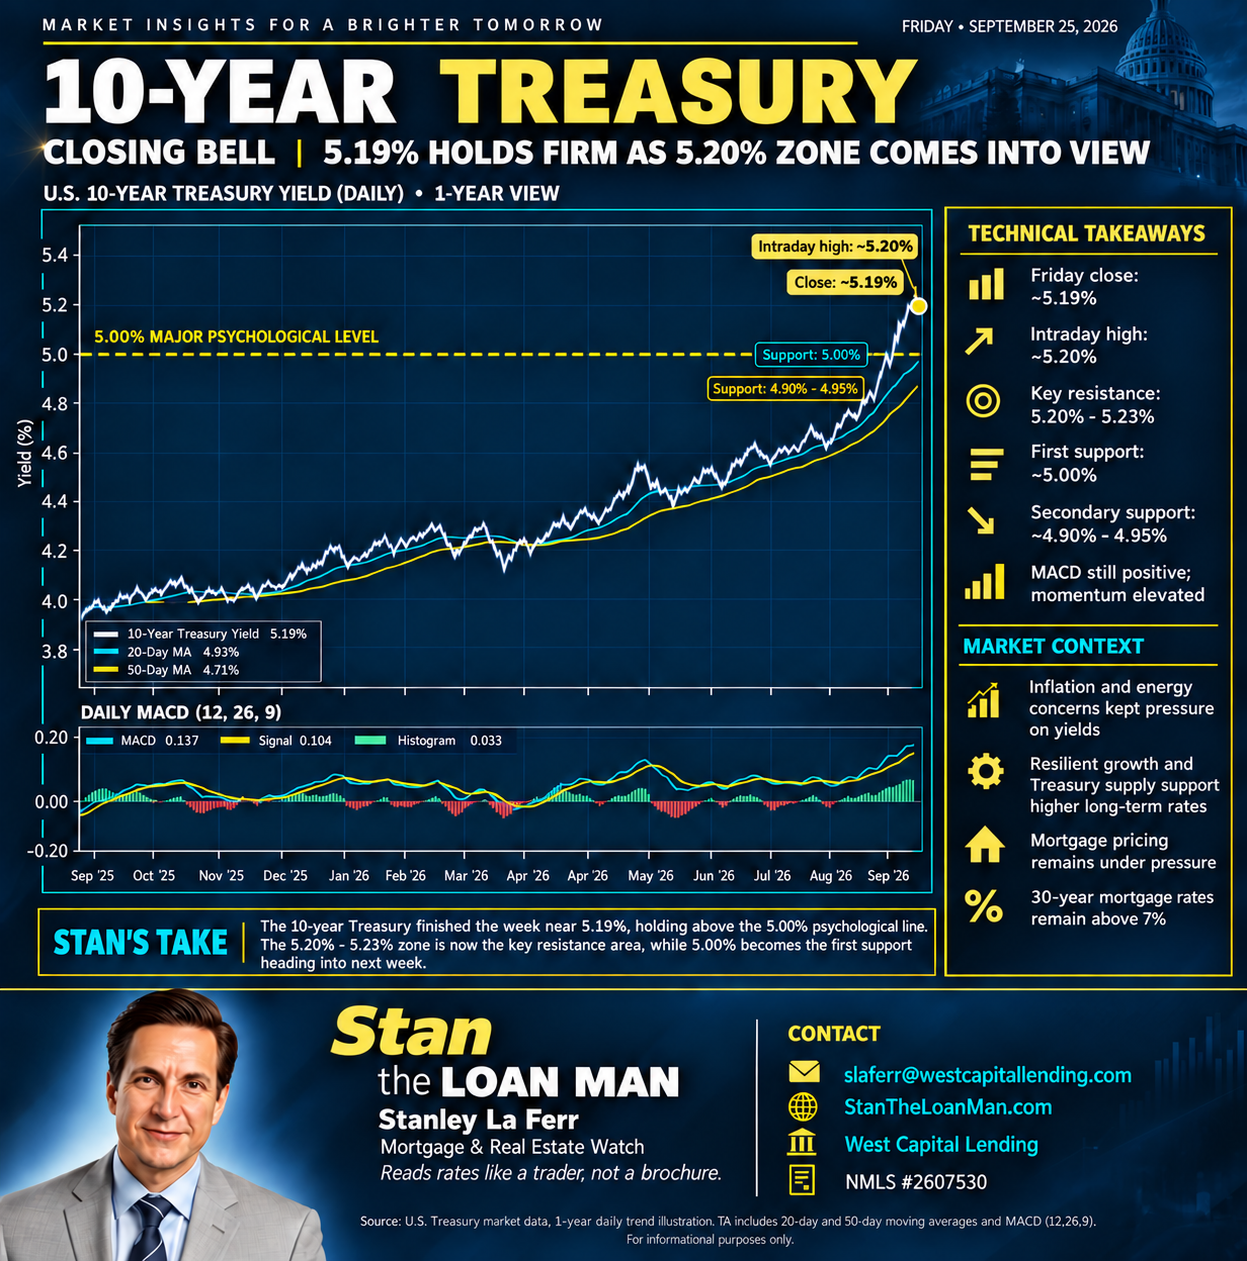
Closing Bell: 10-Year Treasury

Technical levels, momentum and the next catalyst affecting the bond market and mortgage-rate backdrop.

Coming soon